| Did you know ... | Search Documentation: |
| SWI-Prolog IDE --- Execution Profiler |

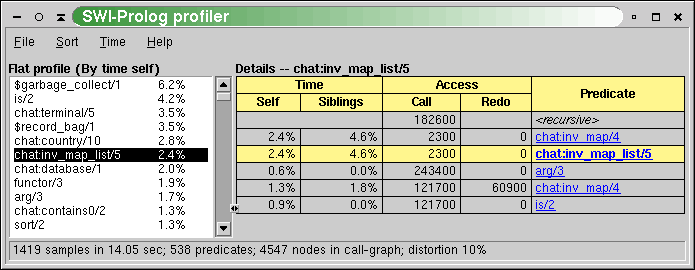
The Execution Profiler displays call- and time statistics on your program. To profile a query, simply run profile/1:
?- profile(mygoal).
The left column can be sorted on different statistics and time can be displayed as percentage, ticks or seconds. The right view displays how time is propagated to the callers as well as the callees (parents and children). It can be navigated and provides a menu to access the source-code and documentation.